intelligence of the numberverse
home
First Published January 2008
For some related ideas about quadratic intervals, perfect squares, and prime numbers, see: Biquadratic Paired Primes and Q-Paired Primes.
What is a quadratic interval?
For this discussion, it is simply the interval between one perfect square on the number line and the next perfect square:
n*n,
(n+1)*(n+1),
(n+2)*(n+2),
(n+3)*(n+3),
. . . .
(For lists of perfect squares up to 1 trillion, see here.)
Of course, perfect squares are perfectly consistent. Their distribution is completely predictable because the interval between one perfect square and the next perfect square conforms to quadratic growth, meaning there exists a finite difference of the 2nd degree in the interval between each successive perfect square. Expressed as a polynomial, this is:
n^2 + 0
(or, simply, n^2)
The finite difference is 2nd degree because it appears in the second row of differences (not because the difference happens to be 2), as illustrated:
9 16 25 36 49
7 9 11 13
2 2 2
In terms of relating one perfect square to the next, the following formula could be given:
n = c+(c-l)+2
where n=next perfect square, c=current perfect square, l=last perfect square.
The concept of graphing numbers according to perfect square intervals originated in the Sacks Number Spiral. The term rotation is synonymous with quadratic interval.
Graphing numbers according to higher-degree polynomials, such as cubic (3rd degree), quartic (4th), and quintic (5th) should also yield interesting results.
Prime Probability: Catch the Wave |
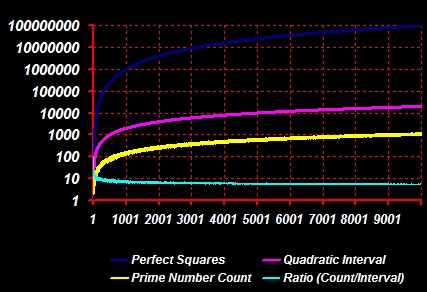
First, a digression about the density of prime numbers as measured by quadratic intervals.... It's been known for a long time that the distribution of prime numbers "up to x is asymptotic to x/log(x), where log(x) is the natural logarithm of x"*. In plain English, the probability of numbers being prime decreases by a predictable amount on a gradual slope the larger those numbers become. If the truth be told, this fact, of itself, is rather dull and unsurprising. What is surprising is the time and effort mathematicians have expended to prove and refine the prime number theorem. Consider the cult obsession with the unproven, perhaps unprovable, Riemann hypothesis. My own little investigation here does not prove anything: it is merely the observation that the number of primes occurring for a given quadratic interval (defined here as the interval between two perfect squares) up to any observable magnitude is actually increasing absolutely. This doesn't contradict the asymptotic rule above, but it is nonobvious that the rate of quadratic growth more than compensates for the decreasing density of primes. Since it's somewhat off-topic, I've created a separate page about this subject with a small program for counting primes by quadratic interval: Counting Primes by Quadratic Interval We are accustomed to thinking about the density of primes continuously decreasing, but if we think about perfect squares as being the 'backbone' of the number line - if we count primes in relation to these regular markers - we can turn this conception on its head and state: The number of primes is increasing with successive quadratic intervals - and at about the same rate as the quadratic intervals. (Refer to the chart and data if you doubt this.) The situation looks like this for numbers under 100 million. In the following graph, the vertical axis is logarithmic. Perfect squares grow the fastest, then the quadratic interval between the perfect squares. Then almost parallel with the interval count, the prime count is shown. It is increasing overall in absolute numbers as measured from one quadratic interval to the next. The trend is not linear, but viewed on the log scale, very close to it. However, as the fourth line shows, the ratio of prime numbers to the quadratic interval is slowly falling off, but at an ever more gradual rate.
Let's now look at the question of how primes and prime factors distribute themselves within each quadratic interval, or rotation. We could call this the "demographics" of natural numbers - demographics being related to "the dynamic balance of a population especially with regard to density and capacity for expansion or decline" (Merriam-Webster). Is there a consistent recognizable pattern to this distribution that can be grasped by graphing numbers in relation to the quadratic interval, rather than some other arbitrary division of the number line? By segmenting the number line using the perfect square as a regular marker, we are in effect designating the quadratic interval to be a constant. Regardless of whether the interval between perfect squares is 7 or 707 or 7007, we will divide this interval into equal amounts. The amounts we divide the interval into don't matter so long as they're equal amounts. For convenience, we can use 360º, or we can use divisions based on powers of 2, for example, such as 1/64th or 1/128th. We can visualize the data by looking at the density of the individual data points or by connecting them together and smoothing the line to gain an impression of change within the interval. The following graph shows the summation of all prime numbers in the first 1000 quadratic intervals, or rotations. It shows the sum of all prime numbers less than 1,000,000 (the perfect square of 1,000) for each 1/360th of the interval. A moving-average (10-unit) trendline is also shown.
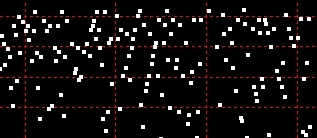
The waveform shown in the graph can also be observed by counting the frequency of primes or by looking at the prime factor distribution of all the composites - for example, the arithmetic mean of the highest prime factor of each composite. Since these statistical methods are cumulative, if the distribution was somehow random it would flatten out over time. This is not the case. In fact, the waveform is quite consistent over time. The noncumulative distributions are equally interesting. For example, the prime number scatter reveals numerous proximate prime polynomials that appear like elongated constellations in a star chart.
|
|
|